Citation Trends
Citation Trends Reports help you track research performance over time. Reports are available for research fields, authors, institutions, regions, journals, research fronts, publication years, and title level data. Both normalized and raw data for the trends calculations are presented with the graph, giving you more information and data transparency.
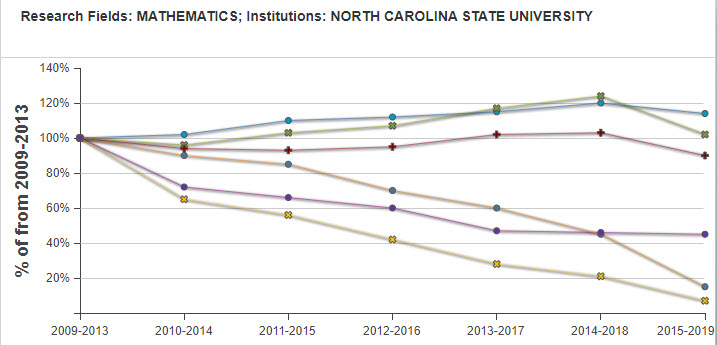
The following example shows the citation trends for all the data rows in Mathematics related to North Carolina State University. Each node on the graph represents the relative percent share of that data point compared to the initial five-year time period for the graph (2009-2013). For example, the blue line node which corresponds to total papers, for the time period 2009-2013, shows the total number of papers for North Carolina State University in the field of Mathematics from 2013-2017 represents ~120% of the number of papers in that same category from 2009-2013.

Under each graph are data tables for normalized and raw data, where normalized data refers to the trend from baseline. Normalized data is color coded and each indicator will correspond to the colored lines on the graph. Citations are aggregated over a five-year period to ensure a more stable trend that provides a better indication of an institution's performance and allows for more appropriate comparison to another institution's performance.
You can save reports for future access when you sign in with a username and password by clicking Save Criteria and assigning a name for your report in the pop-up window.
